![]()
The free PRTG bandwidth meter

PRTG all-in-one web service monitoring tool
24/7 monitoring of
all web services
Round-the-clock monitoring of performance
Real-time monitoring of bandwidth

Why do companies need to monitor bandwidth?
Bandwidth monitoring allows companies to monitor and evaluate the bandwidth of a local area network (LAN) or Wi-Fi. Tools like the PRTG Bandwidth Meter monitor networks and generate data such as download speeds and upload rates.
With this data, companies can filter their bandwidth consumption by endpoints, applications, and ports.
Bandwidth monitoring tools offer companies a wide range of benefits.
Among other things, they provide for an overview of the bandwidth consumption of users, services, or programs, thereby allowing companies to continually improve the performance of their network. Bandwidth monitoring is also useful for determining when it’s time to upgrade bandwidth to do away with bottlenecks and keep a network running smoothly.
Extremely practical, bandwidth monitoring tools indicate which applications or servers are taking up the most bandwidth.
They let you run a bandwidth test to determine the times of the day that bandwidth consumption is the highest.
If you’re wondering why your system is slow and your network sluggish, then a bandwidth monitoring tool can provide some answers.
A good bandwidth monitoring tool will save a company money by showing them exactly when a network must be upgraded – and when it’s better to wait.
The PRTG Bandwidth Meter at a glance
![]() Bandwidth is measured as the amount of data that can be transferred from one point to another within a network in a specific amount of time. Typically, bandwidth is expressed as a bitrate and measured in bits per second (bps). It refers to the transmission capacity of a connection and is an important factor when determining the quality and speed of a network.
Bandwidth is measured as the amount of data that can be transferred from one point to another within a network in a specific amount of time. Typically, bandwidth is expressed as a bitrate and measured in bits per second (bps). It refers to the transmission capacity of a connection and is an important factor when determining the quality and speed of a network.
Read more
![]()
Monitor and classify
The PRTG Bandwidth Meter monitors and classifies the consumption of bandwidth. It provides you with access to real-time data as well as information on long-term trends. As a result, you'll know if and when it’s time to upgrade your bandwidth.
![]()
Resource consumption
The PRTG Bandwidth Meter monitors your consumption of memory and resources. While most monitoring tools only check Internet traffic on a single device, PRTG lets you analyze bandwidth usage across your entire network.
![]()
User-friendly
The great strength of PRTG is its intuitive and user-friendly design. Its easy-to-use web interface lets you configure sensors for your network and create custom usage reports.
![]()
Alarm
Our bandwidth meter also lets you set custom alerts that notify you when bandwidth levels increase. Thanks to these alerts, you can intervene at once and prevent bottlenecks and other performance issues.
![]()
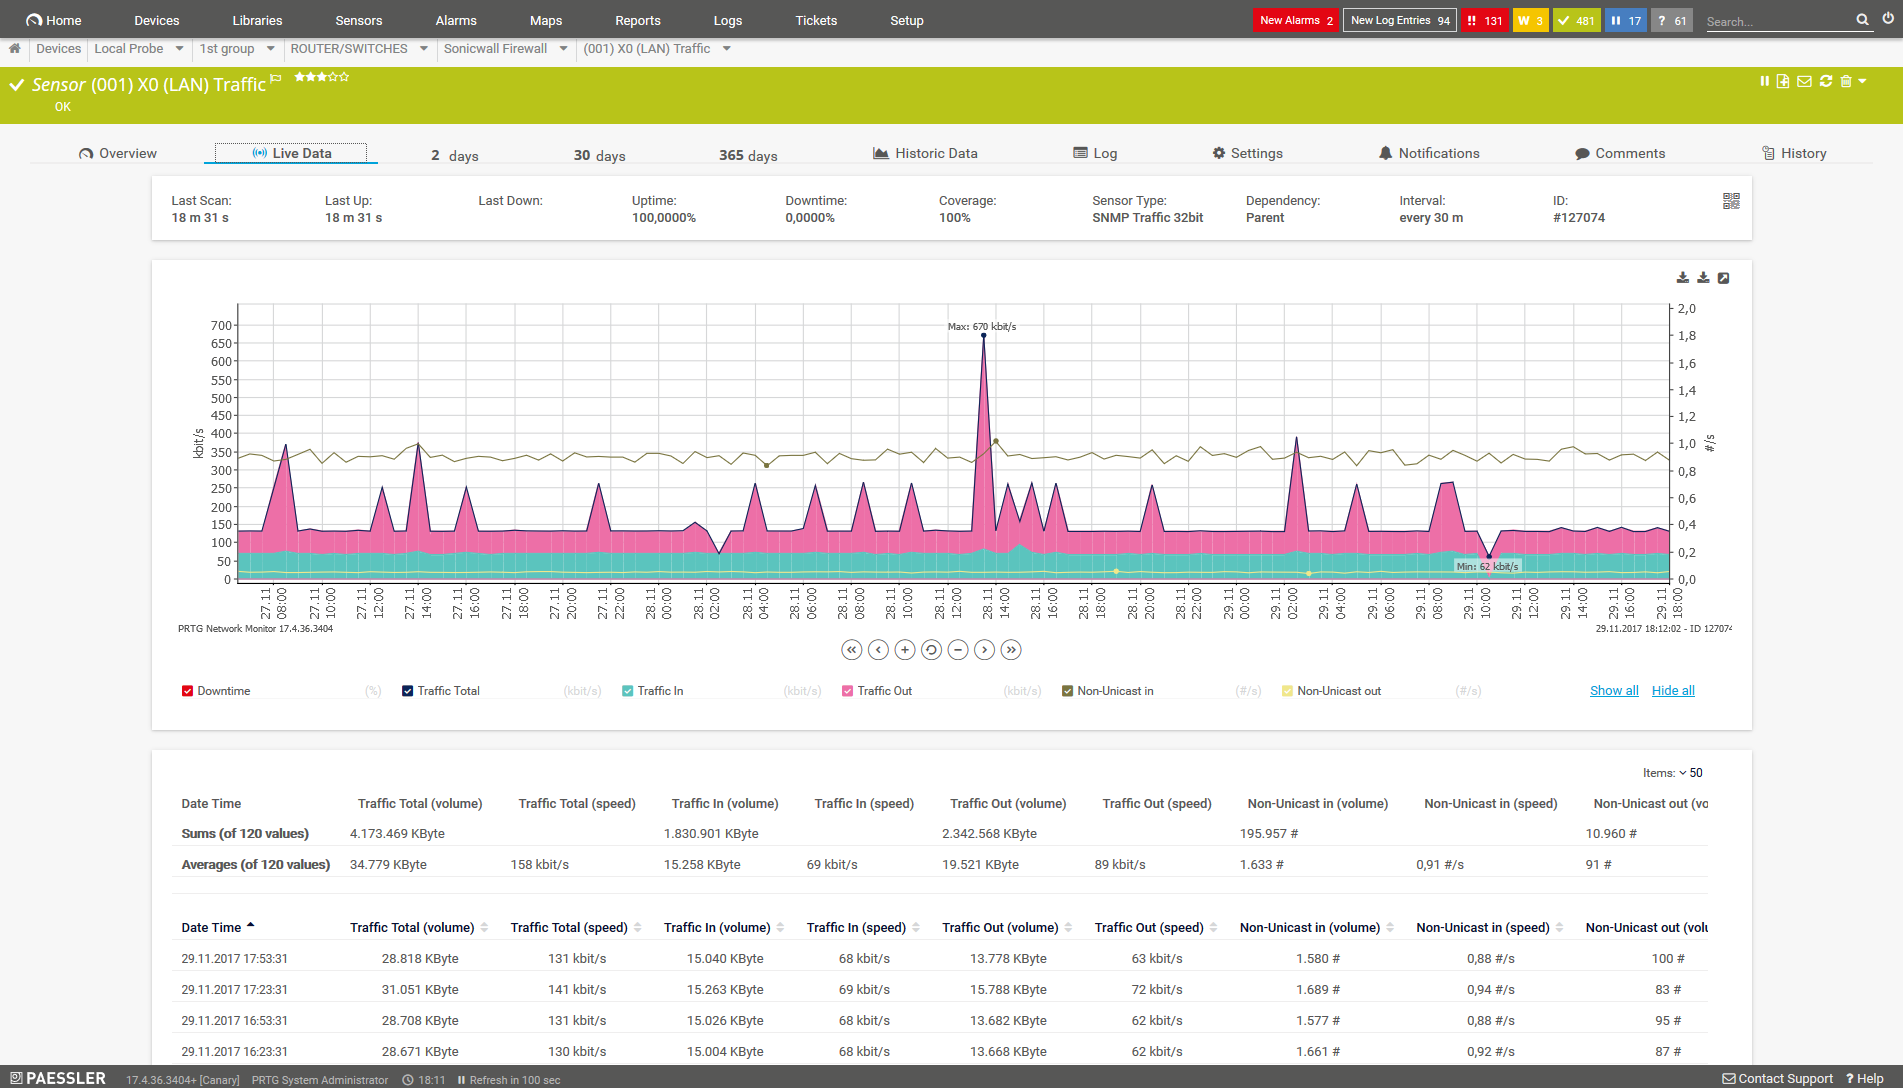
Charts
The PRTG web server provides you with access to tables and charts that illustrate your bandwidth consumption.
![]()
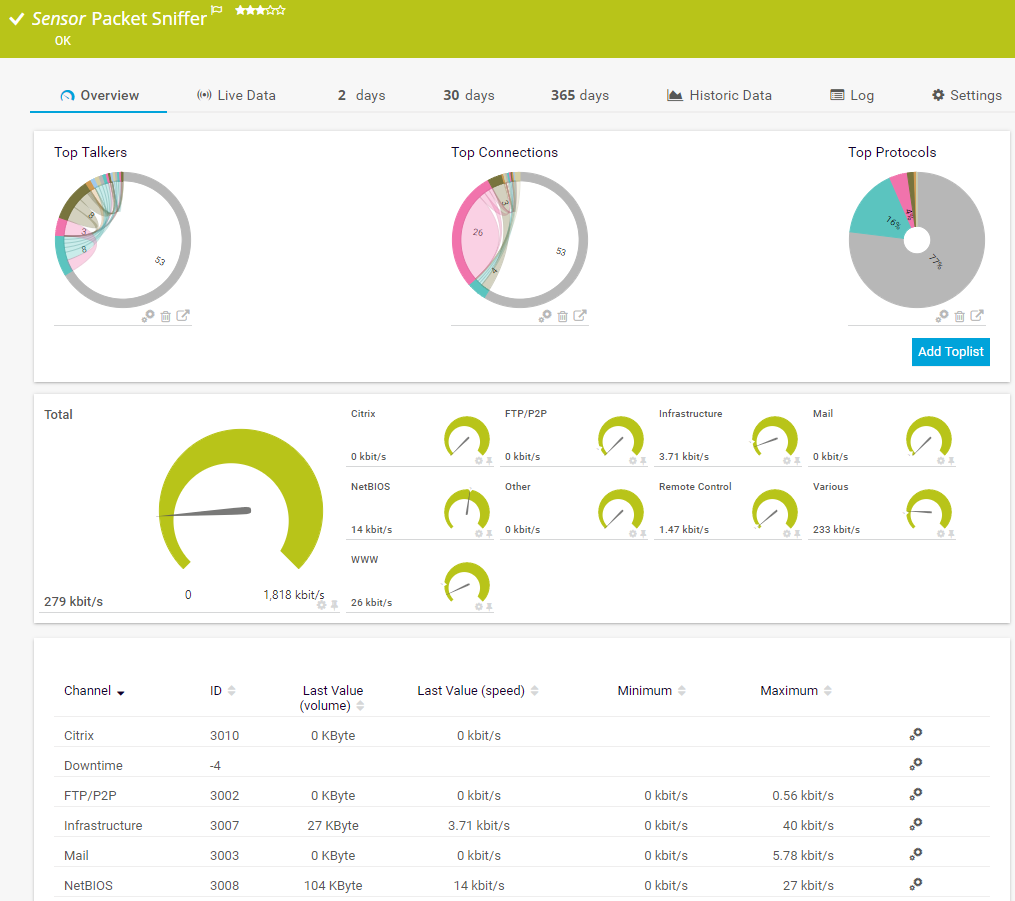
Protocols
PRTG uses a variety of protocols to monitor bandwidth. These include:
- WMI
- Packet sniffing
- SNMP
- Flow
Our network monitor lets you choose from popular protocols that put less of a strain on your network, such as NetFlow, sFlow, and IPFIX, as well as standards with functions like Top Talkers.
PRTG Network Monitor comes in two different versions.
A free version, and a paid version for customers who need more than 100 sensors for their monitoring.

Good to know: What exactly is bandwidth?

“Bandwidth” is the amount of data that can be transferred in a network from one point to another in a certain period of time. It is measured in bits per second (bit/s).
Bandwidth is important as it can be used to measure the quality and speed of your network.
Among other things, these measurements include:
- maximum data flow
- average data flow
- data flow considered “good”
As a result, they let you compare your current bandwidth with your maximum possible bandwidth.
To run a speed test, you’ll usually need special software or firmware (like our bandwidth meter) and a network interface.
Some of the more popular tools include PRTG Network Monitor and TCCP.
These tools tally the total amount of data that is sent and received over a given period of time. You can also transfer files of a certain size and measure how long the transfer takes. The result is then converted into bits/s by the tools or a bandwidth meter.
Bandwidth can vary within a single network, depending on the usage conditions and the network. A single measurement therefore says relatively little about actual bandwidth consumption. However, by taking a series of measurements, you can reliably determine average values and trends.
Bandwidth meter at a glance – even while on the go
Set up PRTG in minutes and use it on almost any mobile device.


Trusted by 500,000 users and recognized
by industry analysts as a leader

“Fantastic network and infrastructure monitoring solution that is easy to deploy and easier still to use. Simply the best available.”

“Software is absolutely perfect, Support is superior. Meets all needs and requirements, this is a must have solution if you are needing any form of monitoring.”

“The tool excels at its primary focus of being a unified infrastructure management and network monitoring service.”

“The greatest advantage of PRTG? You get to rest easy.“
Steffen Ille, Bauhaus-University of Weimar, Germany
PRTG makes your job easier
Our monitoring software frees you to focus on other tasks by promptly notifying you of potential issues.
![]()
Save effort
PRTG gives you one central monitoring tool for your servers and entire network. Enjoy a quick overview of your whole infrastructure via our dashboard and app.
![]()
Save time
Getting started with PRTG is a breeze. Setting up or switching from another network monitoring tool is easy thanks to the auto-discovery and pre-configured device templates.
![]()
Save money
80% of our customers report substantial cost savings with network monitoring. Your costs of licenses will likely pay for themselves within weeks.

PRTG: The multi-tool for sysadmins
Adapt PRTG individually and dynamically to your needs and rely on a strong API:- HTTP API: Access monitoring data and manipulate monitoring objects via HTTP requests
- Custom sensors: Create your own PRTG sensors for customized monitoring
- Custom notifications: Create your own notifications and send action triggers to external systems
- REST Custom sensor: Monitor almost everything that provides data in XML or JSON format
Still not convinced?
![]()
More than 500,000 sysadmins love PRTG
Paessler PRTG is used by companies of all sizes. Sysadmins love PRTG because it makes their job a whole lot easier.
Still not convinced?
![]()
Monitor your entire IT infrastructure
Bandwidth, servers, virtual environments, websites, VoIP services – PRTG keeps an eye on your entire network.
![]()
Try Paessler PRTG for free
Everyone has different monitoring needs. That’s why we let you try PRTG for free. Start now with your trial.
|
PRTG |
Network Monitoring Software - Version 24.2.94.1400 (April 10th, 2024) |
|
Hosting |
Download for Windows and cloud-based version PRTG Hosted Monitor available |
Languages |
English, German, Spanish, French, Portuguese, Dutch, Russian, Japanese, and Simplified Chinese |
Pricing |
Up to 100 sensors for free (Price List) |
Unified Monitoring |
Network devices, bandwidth, servers, applications, virtual environments, remote systems, IoT, and more |
Supported Vendors & Applications |
|